Saturday, April 14, 2012

Revised Universal Soils Loss Equation

I'm back! I know it's infrequent but eh...I have some time so thought I'd try and post a little more.

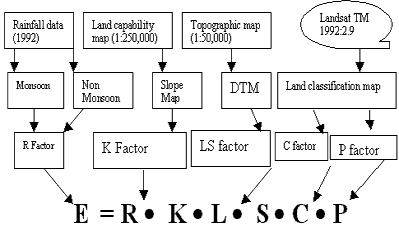
Today's post is going to feature a model of soil erosion that I have gotten all too familiar with during my independent undergrad research (still need to write a post about that). A very quick background/introduction to my research to provide backing for this model is I am looking at soil erosion in three different sub-watersheds of the Rappahannock River. One way of measuring the soil erosion taking place or at least estimating this soil erosion is through modeling. The Revised Universal Soils Loss Equation is just one model to do this and the equation is as follows:

A=RKLSCP

Where A is equal to the total soil loss annually, R is a rainfall index factor, K is the soil erodibility factor, LS is slope length/gradient factor, C is a land use cover factor, and P is support practice factor.

Shows E=RKLSCP instead of A=RKLSCP but concept is the same.

The way the model works is you can model various plots of land to idealistic conditions where you can change the C and P factors. You can change these factors as they are human dependent. C is land use so you can vary different crops on land or even plant trees or clear land. P is support practices such as no till agriculture and other new age farming techniques. The other factors you cannot change and are dependent on climatic zones and regional topology.

Wednesday, January 11, 2012

Google's Geology Logo and Nicolas Steno's Birthday


Once I saw what was Google's new image logo for today I knew I had to write a post on it. It's all about Geology! More specifically it's referencing a famous Geologist and the founder of modern stratigraphy, Nicolas Steno. As it is is 374th birthday today.

I'm sure most of you reading this have no idea who Nicolas Steno is or stratigraphy or why it is important, but nonetheless. Basically Steno came up with the defining principles in the science of stratigraphy which are; the law of superposition, original horizontality, lateral continuity, and cross-cutting discontinuities. I'll give a brief overview of what each means.

The law of superposition basically means that at the time that any given stratum (layer of rock) is being formed, nothing above it existed. The law of original horizontality means that any given strata was once horizontal to the horizon even if it is now titled or perpendicular. Later continuity means that a given strata's material was continuous across earth unless barriers were present. And lastly, the law of cross-cutting discontinuities means that if a body or discontinuity cuts across a given strata it happened after that strata was formed (and therefor is younger in the geologic timescale).

Happy Birthday to Nicolas Steno!

Monday, January 9, 2012

Guide to Using an Interference Color Chart

For today's post I thought it would be useful and fun to go over an important tool for Geologists and especially Mineralogists to identify minerals. This tool is simply called an Interference Color Chart. This Interference Color chart was first developed by Auguste Michel-Lévy, a French Geologist, who was a pioneer in mineral classification through birefringence. Without going too much into a Geology university lecture, birefringence are colors we observe in a thin section with a petrographic microscope that results from the differences in speed of the slow and fast light ray as they pass through a mineral.

The Interference Color Chart looks like this:


Now I know in my above picture everything is hard to see/read but you do get the idea of how one is set up. I do have a reason for picking this exact image. It just so happens (and I was very surprised to find it in a Google image search) that this is the same Interference Color Chart that we used in my Mineralogy course. German and all! The reason we used this German chart was my professor said this is the best out there. All the other ones are not accurate enough and are skewed, so we used this German one even though we all speak English. But it was kind of funny as she had to write the mineral name translations on the board which was also interesting. For example the mineral Feldspar was Feldspat, Olivine was Olivit, etc.

So how do you use this chart? Well, first off you optically observe a thin section under a petrographic microscope under cross polarization and observe any  birefringence colors you may see. If you don't know the mineral you are looking at then you can find the color you are seeing under the microscope and compare it to the chart. However, you do have to take into consideration thickness of your thin section. Standard and well prepared thin sections are 30 microns which is the marked as the middle horizontal line on the Color Chart so that is where you should always be referring to. Sometimes parts of the mineral/thin section will be thinner or thicker and could be noted on the thin section slide itself. If this is the case you may want to look either above or below that middle 30 micron line.

Now I know it is slightly confusing as there are repeated colors on the Interference Color Chart, it is not all one rainbow spectrum. These are called orders. So from the left going right you have 1st order, 2nd order, etc. 1st order starts with the black on the far left and stops at the first red, 2nd order starts at that first red and stops at the second red, 3rd order the same, etc, etc. You always want to note the highest color order for the particular mineral you are observing. For example, note that it could be 1st order grey, or 2nd order blue-purple. Any descriptions are helpful in mineral observations and identification.
Tuesday, January 3, 2012

Thin Sections- An Overview

Thin Section (in cross polarized) of Tremolite and Cummingtonte
If you’ve taken a higher level Geology course like Mineralogy or Sediments and Stratigraphy you may have some experience with thin sections of minerals and rocks. Love them or hate them you have to admit they are very interesting and can be fun if you don’t have to do assignments on them.


A thin section of a rock is just a very thin slice of a particular rock, usually 30 microns, in order to view different optical properties of various rock types and mainly different minerals. You see different minerals may look different in hand sample but under a petrographic microscope (ours can go 400x magnification) you can see some major differences. Some major features to observe when looking at a thin section and ones that I’ll go over in more detail later are; pleochroism, anisotropic/isotropic, interference colors (birefringence/retardation), and twinning.

As you can see by my pictures, thin sections can show very colorful and interesting pictures. Who would have thought rocks and minerals could look so cool. This is what I meant by thin sections could be fun. While I was studying thin sections for my exam in mineralogy it wasn’t too bad as I could see these pretty colors and crazy shapes and as another professor of mine said, “It’s trippy man!”.